The biggest obstacle in self-serve analytics is Context.
We build dashboards, but stakeholders still DM us: "Hey, does this number include free trial users?" or "Why is this different from the Board Deck?".
The problem isn't the data. It's the context. Dashboards hide the logic. SQL queries bury it. And until now, AI Agents hallucinated it because they didn't know your business definitions.
But today, the stack changed.
With dbt, we can bake context directly into the data warehouse. And with Anthropic's Model Context Protocol (MCP), we can give Claude direct, read-only access to that context, enabling self-serve analytics for non-technical users.
Here is how I built a hallucination-proof analytics agent in 3 steps:
- The Semantic Layer (dbt): Push rich, prompt-engineered metric definitions to BigQuery via dbt's
persist_docs. - Connecting Claude (The MCP Server): Configure Claude Desktop with Google MCP Toolbox to access BigQuery with its metadata.
- The Magic Moment: Ask natural language questions and let Claude generate accurate SQL based on the provided context.
The Architecture: "Context as Code"
Most people try to fix AI hallucinations by writing giant "System Prompts" (e.g., "You are a data analyst. Active means... DAU means 'Daily Active Users', it means..."). That’s fragile. Instead, we are going to push the definitions into the database schema itself, so it always stays up-to-date with your information architecture and Claude can read them just like a human analyst would.
The Stack
Here's the stack I used:
- GrowthCues Core: Calculates metrics and pushes definitions to BigQuery.
- BigQuery: Stores the data AND the metadata (column descriptions).
- Claude Desktop: The conversational interface and LLM that answers questions.
- Google MCP Toolbox: The bridge that allows Claude to query BigQuery directly.
Step 1: The Semantic Layer (dbt)
I recently open-sourced GrowthCues Core, a dbt project for B2B SaaS GTM.
The secret sauce isn't just the SQL; it's the YAML. I configured the project to use persist_docs.
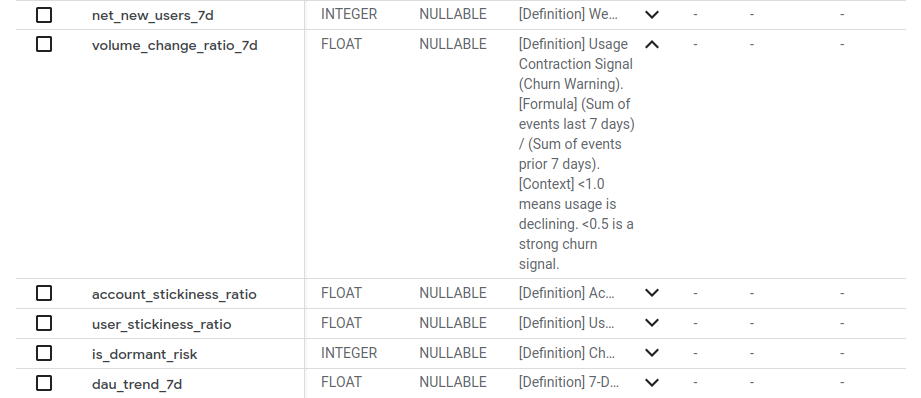
The table and column descriptions are where the magic happens. For example, for the volume_change_ratio_7d column (a key churn signal), I wrote this description:
- name: fct_account_metrics_daily
  columns:
  - name: volume_change_ratio_7d
    description: >
    [Definition] Volumetric Churn Signal.
    [Context] < 0.5 = High Risk (Usage halved). > 1.5 = Expansion.
When I run dbt run, dbt takes these rich, prompt-engineered descriptions and writes them into the BigQuery column metadata. Now, the definition of "Churn Risk" lives inside the warehouse, not in a Notion doc.
Step 2: Connecting Claude (The MCP Server)
This is the cool part. We don't need to build a custom chatbot. We just use the Claude Desktop App. Here I assume you have a BigQuery instance with the GrowthCues Core models and metadata already set up. And that you have the latest version of Claude Desktop installed.
Configure the MCP Server
I use Google MCP Toolbox to set up a Model Context Protocol (MCP) server that exposes my BigQuery instance to Claude. For this, you need to install the toolbox.exe binary somewhere on your machine. Then, configure Claude Desktop to use it in your claude_desktop_config.json.
Open the claude_desktop_config.json file on your computer.
- Mac:
~/Library/Application Support/Claude/claude_desktop_config.json - Windows:
%APPDATA%\Claude\claude_desktop_config.json
Here's the configuration I added to connect to BigQuery:
{
  "mcpServers": {
    "bigquery": {
      "command": "./PATH/TO/toolbox",
      "args": ["--prebuilt", "bigquery", "--stdio"],
      "env": {
        "BIGQUERY_PROJECT": "PROJECT_ID"
      }
    }
  }
}
The BIGQUERY_PROJECT environment variable specifies the default Google Cloud Project ID for the MCP Toolbox to use. All BigQuery operations, such as executing queries, are run within this project.
The Google MCP Toolbox provides the following tools for interacting with BigQuery via MCP:
- analyze_contribution: perform contribution analysis, also called key driver analysis.
- ask_data_insights: perform data analysis, get insights, or answer complex questions about the contents of BigQuery tables.
- execute_sql: execute SQL statement.
- forecast: forecast time series data.
- get_dataset_info: get dataset metadata.
- get_table_info: get table metadata.
- list_dataset_ids: list datasets.
- list_table_ids: list tables.
- search_catalog: search for a table using natural language.
Authentication
To authenticate, I set up Application Default Credentials (ADC) on my local machine with the Google Cloud CLI. If you haven't done this before, install the Google Cloud CLI and run:
gcloud auth application-default login
The command will open a browser window for you to log in with your Google account. This lets the MCP Toolbox use my Google user credentials to access BigQuery. You might also need to set the default project in gcloud (typically to the same project ID as above):
gcloud config set project PROJECT_ID
Now, restart your Claude Desktop. You should now have BigQuery tool connected via MCP.
MCP connects the pipe, but you still need to tell Claude which faucet to turn on. If you don't, it might scan your entire Google Cloud project looking for tables. I recommend creating a simple markdown file called growthcues_context.md that acts as a "soft system prompt". It identifies the relevant dataset and tables, and gives instructions on how to interpret the key metrics using the metadata. It’s not a rigid, instruction-heavy prompt; it’s more of a guide that Claude can refer to when analyzing the data.
# **SYSTEM INSTRUCTIONS: GTM Analytics Agent**

You are an expert B2B SaaS Product Analyst. You have access to a BigQuery data warehouse via the MCP tool.

## **1. The Data Source**

All relevant data is located in the dataset: growthcues_dataset.
**Do not** query raw tables (like tracks or identifies). Only query the modeled tables listed below.

## **2. The Semantic Layer (CRITICAL)**

The database schema is **AI-Ready**. The logic for every metric is embedded directly in the BigQuery column descriptions using persist_docs.
**You MUST read the column descriptions before querying.** They contain specific tags:

- [Definition]: What the metric is.
- [Formula]: How it is calculated (e.g., "Active Days / 7").
- [Context]: How to interpret it (e.g., "< 0.5 is high churn risk").

## 3. The Core Tables

### A. Global Health (fct_product_metrics_daily)

- **Grain:** 1 row per Day.
- **Use for:** Executive reporting, total user base size, global stickiness.
- **Example Metrics:** dau, mau, dau_trend_30d (Velocity).

### B. Account Health (fct_account_metrics_daily)

- **Grain:** 1 row per Account per Day.
- **Use for:** Customer Success, Product-Led Sales, Churn Analysis.
- **Example Signals:**
  - volume_change_ratio_7d: **\< 0.5** indicates Silent Churn Risk.
  - net_new_users_7d: **\> 0** indicates Expansion/Upsell potential.
  - is_dormant_risk: Binary flag for accounts that stopped active usage this week.

### C. User Behavior (fct_user_metrics_daily)

- **Grain:** 1 row per User (Latest Snapshot).
- **Use for:** Identifying Champions, Power Users, and Lifecycle states.
- **Example Signals:**
  - usage_rank_in_account: **1** \= The Champion (Top user).
  - active_days_last_14: **\> 8** \= Power User habit (L14).
  - user_lifecycle_status: New, Active, Dormant, Resurrected, or Churned.

### D. Metadata (dim_accounts, dim_users)

- Use dim_accounts to e.g., filter by current_active_seats (Account Size).
- Use dim_users to map user_id to latest_account_id.

## 4. Analysis Rules & Workflow

1. **Inspect First:** Always call get_table_info (or describe) on the relevant table before writing SQL.
2. **Trust the Tags:** If a column description says [Context] High Risk < 0.5, rely on that threshold. Do not hallucinate your own churn definitions.
3. **Date Handling:**
   - Use CURRENT_DATE() for recent data.
   - Always filter metric_date to avoid full table scans (e.g., WHERE metric_date >= DATE_SUB(CURRENT_DATE(), INTERVAL 30 DAY)).
4. **Synthesis:** When answering:
   - Show the SQL you generated.
   - Summarize the insight in plain business English.
   - Highlight specific accounts or users that need attention.
Load this file into Claude Desktop as a "Context File" for your MCP BigQuery server (drag and drop it into the chat window). This gives Claude a focused understanding of your data model and how to interpret the metrics. Instead of a giant system prompt, you have a lightweight context file that Claude can refer to; all the needed definitions are in the database itself!
Step 3: The Magic Moment
I don't paste a schema. I don't paste a prompt. I just ask a business question (in natural language).
Example Interaction
What's going on with our product growth on 19th March, 2023?
(My demo data is a bit outdated, sorry about that...)
Claude responds by first reading the column descriptions to understand the definitions of key metrics like dau_trend_30d and volume_change_ratio_7d.
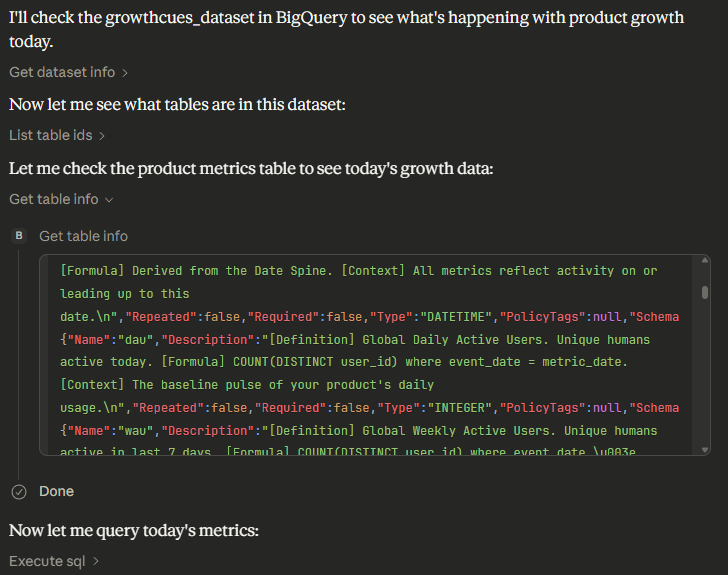
Then, it generates SQL that queries the relevant tables, using the definitions from the metadata to interpret the results correctly. The result is a clear, actionable insight about the product growth on that date.
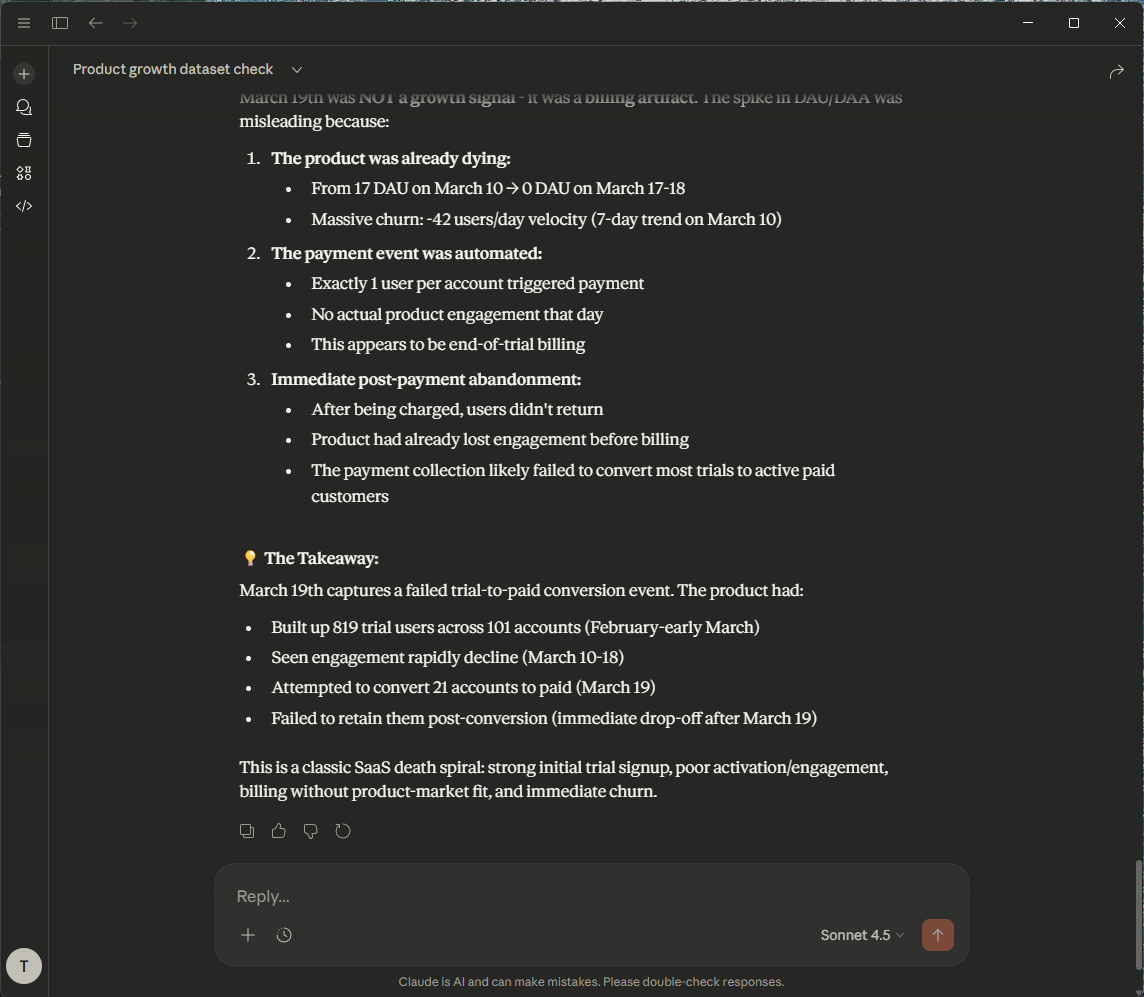 That's bad! Let's ask Claude on how to save our business...
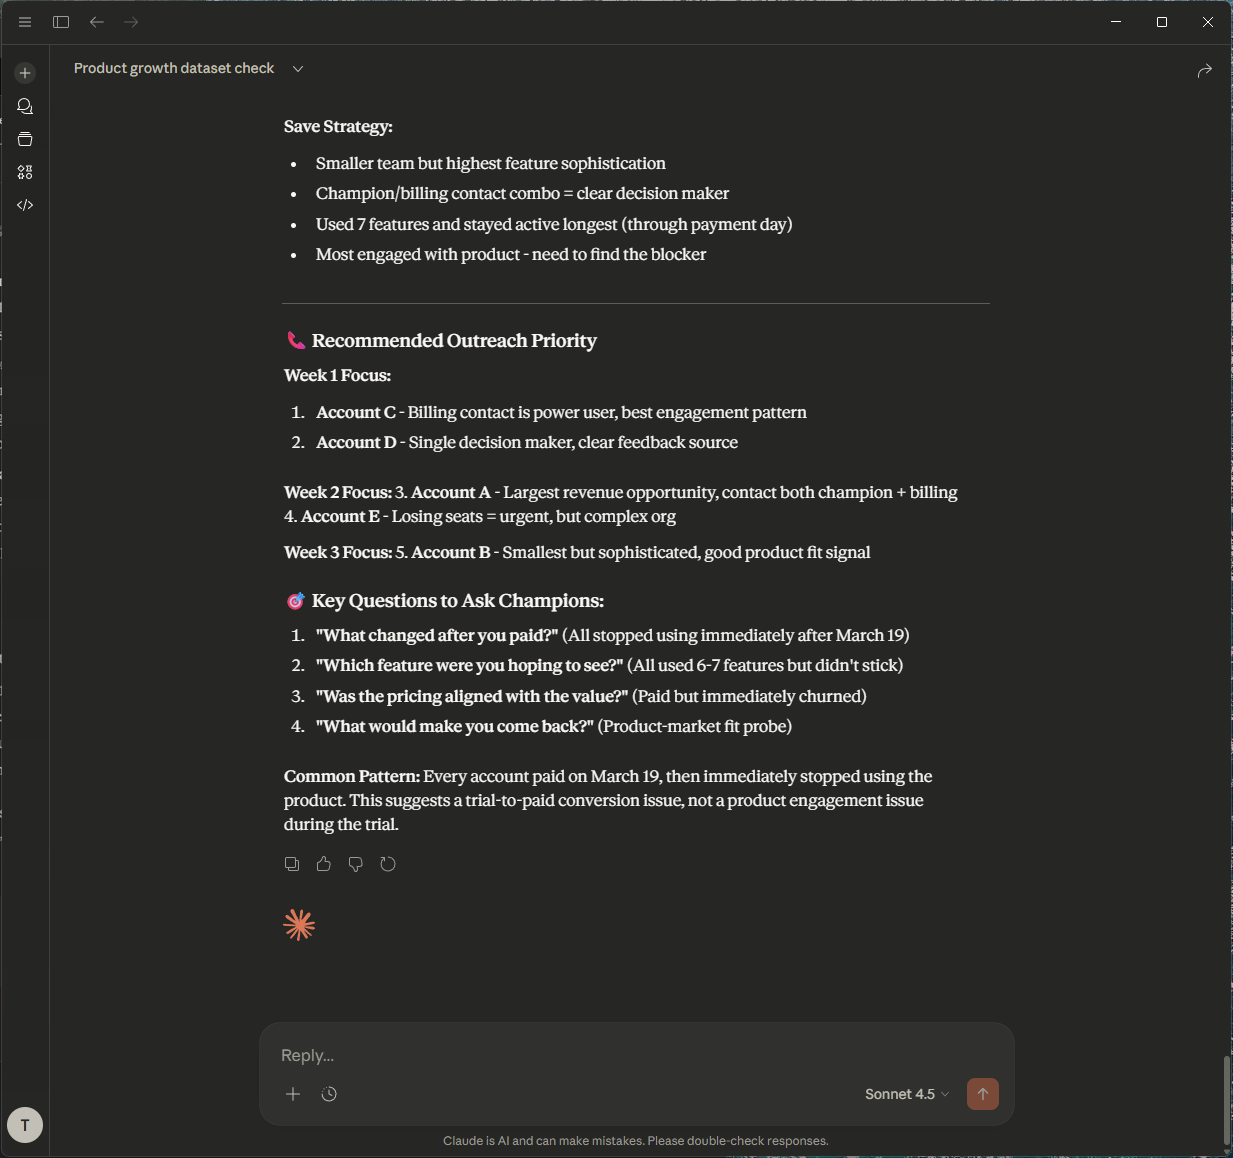
Thanks! Show me top 5 accounts which I could save, with champions to contact.
Claude again reads the metadata to understand what "save" means in this context (e.g., accounts with volume_change_ratio_7d < 0.5 and is_dormant_risk = True). It generates SQL to find those accounts and identifies the champion users within them.
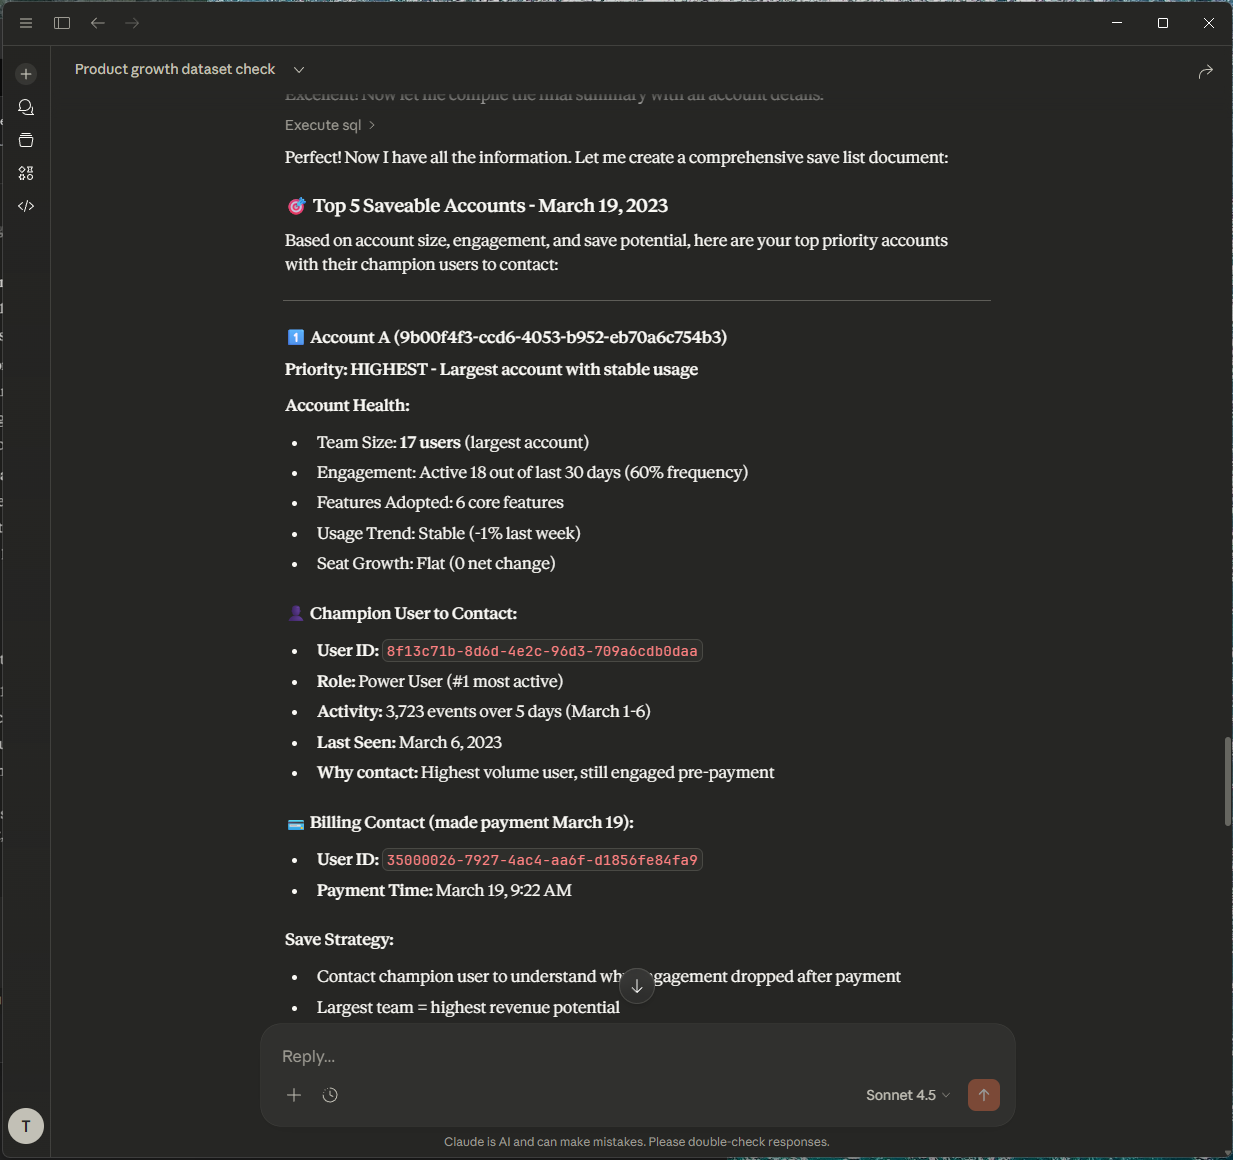 Claude even made us a plan to save those accounts by contacting the champions, who are the most active users in those accounts. Let's save those customers!
Conclusion: The Future of GTM Engineering
This is the future of GTM engineering. We just enabled a self-serve analytics agent that can answer complex business questions without any prompt engineering or custom UI development. The key was treating context as code and leveraging the Model Context Protocol to give Claude direct access to our data and metadata. This approach has several advantages:
- Single Source of Truth: If I change the definition of "Churn" in dbt, the context updates instantly. No prompt re-writing needed. The code is the context.
- Zero UI: I didn't build a Streamlit app. I didn't buy a BI tool. I just exposed the warehouse to the LLM via a standard protocol.
- No Hallucinations: Because Claude reads the well-structured column descriptions before querying, it doesn't guess.
If you want to try this, you can grab the dbt logic for the B2B metrics from my open-source repo below. The MCP setup takes about 15 minutes.
Get the GrowthCues Core Repo here: https://github.com/ArvoanDev/growthcues-core
Star it, fork it, and start building your own zero-context analytics agent today.
How does "context as code" prevent AI hallucinations?
"Context as code" means embedding the definitions and business logic of your metrics directly within your data warehouse's schema (e.g., using dbt's persist_docs). This provides LLMs like Claude with a definitive, machine-readable "dictionary" of your data, preventing them from guessing or fabricating answers when asked about specific metrics.
Further Reading
- Model Context Protocol Documentation for technical details on implementing the protocol.